Shiny#
The Guide has moved!
The information on this website may be outdated as of July 2025. Please view the new curriculum guide located at https://curriculum-guide.datahub.berkeley.edu/
Shiny is a R package which makes it easy to build interactive web apps. R shiny server in Datahub is used to build interactive dashboards. Here is a short demo of a shiny application below,
Fig. 1 Short Demo to launch Shiny application in Datahub#
If you are interested to explore Shiny application further then you can play with examples from this Github repository and few other examples created by a stats faculty. Here are couple of approaches you can take to launch a shiny application,
Approach I:
Install the nbgitpuller plugin in Google Chrome/Mozilla Firefox browser.
Upload the chosen Shiny application to Github
Paste the URL for the datahub you are using (If you are using Shiny hub then paste https://shiny.datahub.berkeley.edu/) and open it using “Shiny” option in the nbgitpuller plugin.
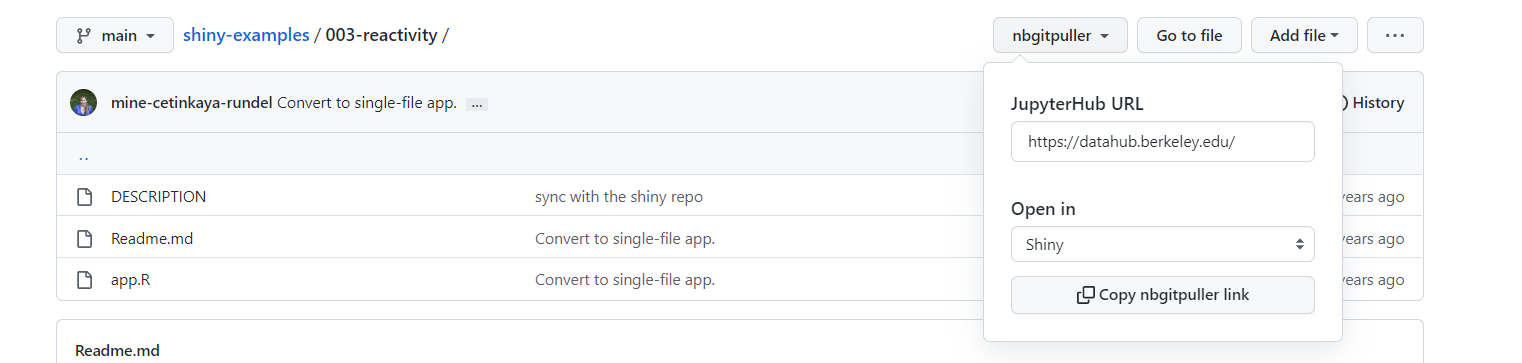
Fig. 2 Launch Shiny application via nbgitpuller plugin#
Paste the link in a browser to access the shiny application. Here is an example link.
Approach II:
Clone the required GitHub repository having Shiny examples to your instance of Jupyterhub.
Launch the Shiny server.
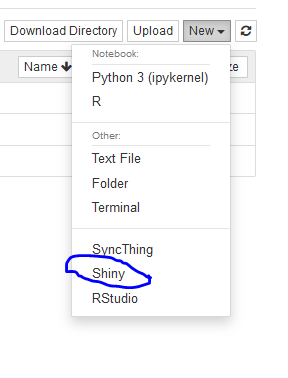
Fig. 3 Short Launch Shiny#
Point the Shiny server to an example from the cloned repository.
Explore the rendered example using shiny dashboard.
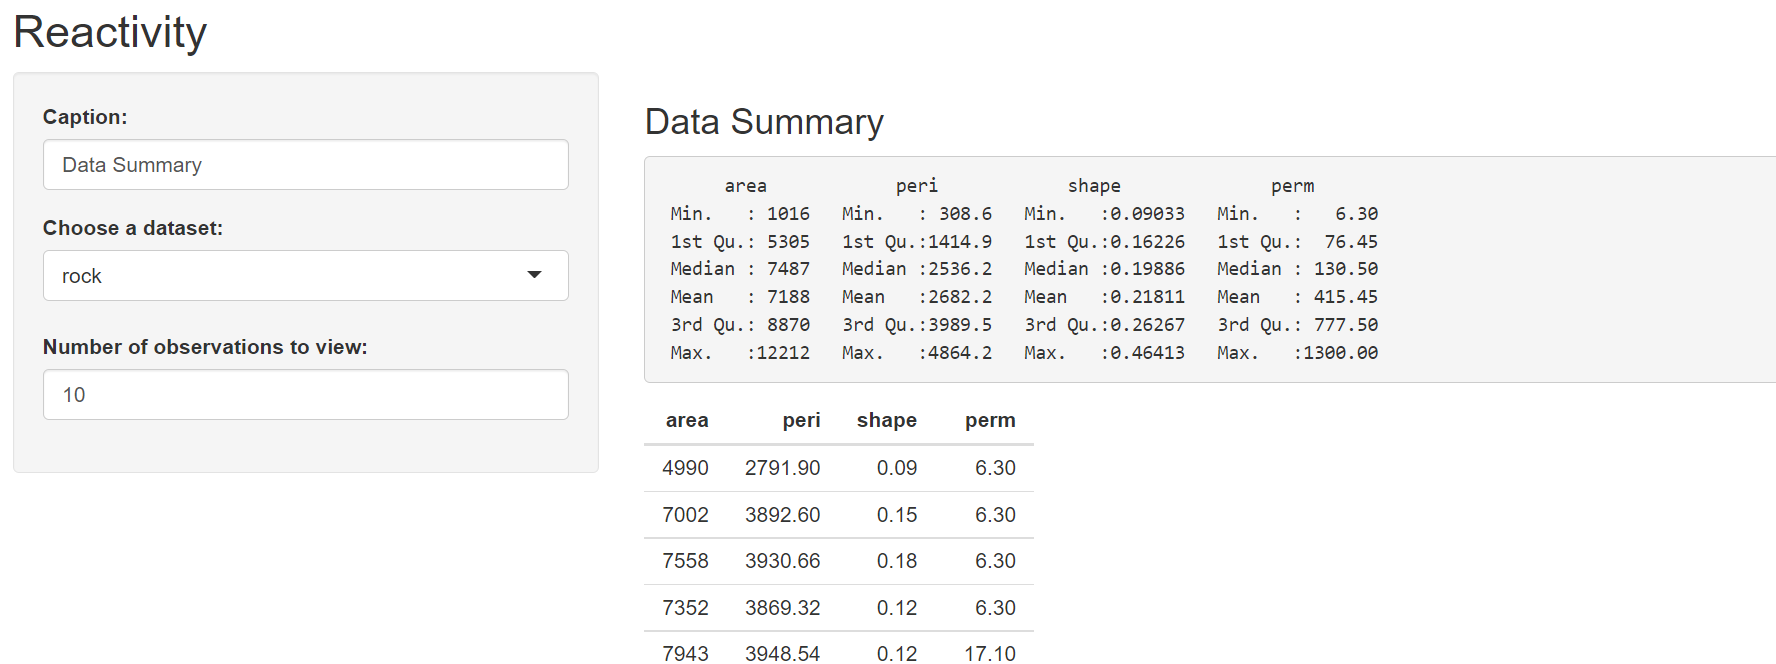
Fig. 4 Explore Shiny Dashboard#
You can also view the code that generated the dashboard in the rendered output.
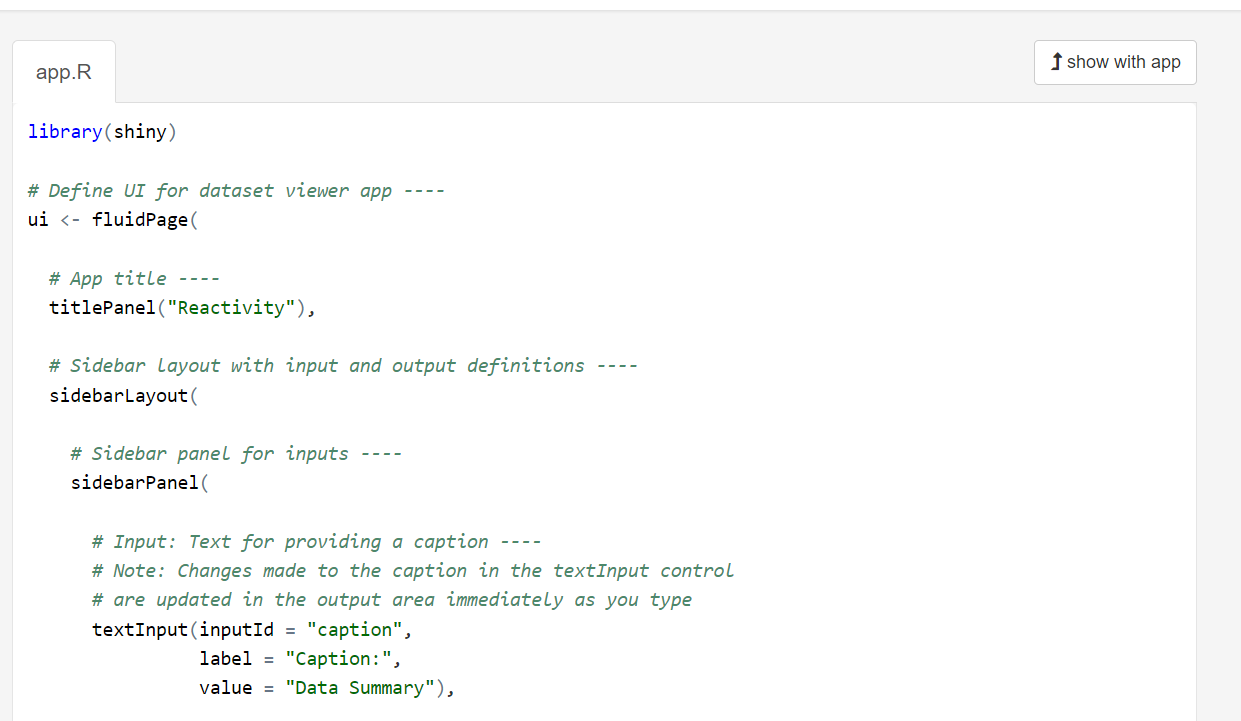
Fig. 5 Code that generates Shiny dashboard#