
ENGLISH R1A: Chinatown and the Culture of Exclusion
Instructor: Amy Lee
Developers: Michaela Palmer, Maya Shen, Cynthia Leu, Chris Cheung
FPF 2017
Welcome to lab! Please read this lab in its entirety, as the analysis will make a lot more sense with the background context provided. This lab is intended to be a hands-on introduction to data science as it can be applied to Chinatown demographics and analyzing primary texts.
We will be reading and analyzing representations of Chinatown in the form of data and maps. In addition, we will learn how data tools can be used to read and analyze large volumes of text.
What this lab will cover
- Running Jupyter Notebooks
- Data Analysis of Chinatowns’ demographics
- Visualization & Interpretation
- Using Data Tools to Analyze Primary Texts
What you need to do
- Read the content, complete the questions
- Analyze the data
- Submit the assignment
1. Running Jupyter Notebooks
You are currently working in a Jupyter Notebook. A Notebook allows text and code to be combined into one document. Each rectangular section of a notebook is called a “cell.” There are two types of cells in this notebook: text cells and code cells.
| Jupyter allows you to run simulations and regressions in real time. To do this, select a code cell, and click the “run cell” button at the top that looks like ▶ | to confirm any changes. Alternatively, you can hold down the shift key and then press return or enter. |
In the following simulations, anytime you see In [ ] you should click the “run cell” button to see output. If you get an error message after running a cell, go back to the beginning of the lab and make sure that every previous code cell has been run.
Part 0: Introduction to Python and Jupyter Notebooks:
1. Cells, Arithmetic, and Code
In a notebook, each rectangle containing text or code is called a cell.
Cells (like this one) can be edited by double-clicking on them. This cell is a text cell, written in a simple format called Markdown to add formatting and section headings. You don’t need to worry about Markdown today, but it’s a pretty fun+easy tool to learn.
| After you edit a cell, click the “run cell” button at the top that looks like ▶ | to confirm any changes. (Try not to delete the instructions.) You can also press SHIFT-ENTER to run any cell or progress from one cell to the next. |
Other cells contain code in the Python programming language. Running a code cell will execute all of the code it contains.
Try running this cell:
print("Hello, World!")
Hello, World!
We will now quickly go through some very basic functionality of Python, which we’ll be using throughout the rest of this notebook.
1.1 Arithmetic
Quantitative information arises everywhere in data science. In addition to representing commands to print out lines, expressions can represent numbers and methods of combining numbers.
The expression 3.2500 evaluates to the number 3.25. (Run the cell and see.)
3.2500
3.25
We don’t necessarily always need to say “print”, because Jupyter always prints the last line in a code cell. If you want to print more than one line, though, do specify “print”.
print(3)
4
5
3
5
Many basic arithmetic operations are built in to Python, like * (multiplication), + (addition), - (subtraction), and / (division). There are many others, which you can find information about here. Use parentheses to specify the order of operations, which act according to PEMDAS, just as you may have learned in school. Use parentheses for a happy new year!
2 + (6 * 5 - (6 * 3)) ** 2 * (( 2 ** 3 ) / 4 * 7)
2018.0
1.2 Variables
We sometimes want to work with the result of some computation more than once. To be able to do that without repeating code everywhere we want to use it, we can store it in a variable with assignment statements, which have the variable name on the left, an equals sign, and the expression to be evaluated and stored on the right. In the cell below, (3 * 11 + 5) / 2 - 9 evaluates to 10, and gets stored in the variable result.
result = (3 * 11 + 5) / 2 - 9
result
10.0
2. Functions
One important form of an expression is the call expression, which first names a function and then describes its arguments. The function returns some value, based on its arguments. Some important mathematical functions are:
| Function | Description |
|---|---|
abs |
Returns the absolute value of its argument |
max |
Returns the maximum of all its arguments |
min |
Returns the minimum of all its arguments |
round |
Round its argument to the nearest integer |
Here are two call expressions that both evaluate to 3
abs(2 - 5)
max(round(2.8), min(pow(2, 10), -1 * pow(2, 10)))
These function calls first evaluate the expressions in the arguments (inside the parentheses), then evaluate the function on the results. abs(2-5) evaluates first to abs(3), then returns 3.
A statement is a whole line of code. Some statements are just expressions, like the examples above, that can be broken down into its subexpressions which get evaluated individually before evaluating the statement as a whole.
2.1 Calling functions
The most common way to combine or manipulate values in Python is by calling functions. Python comes with many built-in functions that perform common operations.
For example, the abs function takes a single number as its argument and returns the absolute value of that number. The absolute value of a number is its distance from 0 on the number line, so abs(5) is 5 and abs(-5) is also 5.
abs(5)
5
abs(-5)
5
Functions can be called as above, putting the argument in parentheses at the end, or by using “dot notation”, and calling the function after finding the arguments, as in the cell immediately below.
from datascience import make_array
nums = make_array(1, 2, 3)  # makes a list of items, in this case, numbers
nums.mean() # finds the average of the array
2.0
1: Exploring Demographic Data:
1.1 Importing Modules
First, we need to import libraries so that we are able to call the functions from within. We are going to use these functions to manipulate data tables and conduct a statistical analysis. Run the code cell below to import these modules.
%%capture
from datascience import *
import numpy as np
import matplotlib.pyplot as plt
from ipywidgets import *
%matplotlib inline
import folium
import pandas as pd
from IPython.display import HTML, display, IFrame
import folium
import spacy
from wordcloud import WordCloud
from textblob import TextBlob
import geojson
Official map of Chinatown in San Francisco - 1855
Prepared under the supervision of the special committee of the Board of Supervisors. July 1885.
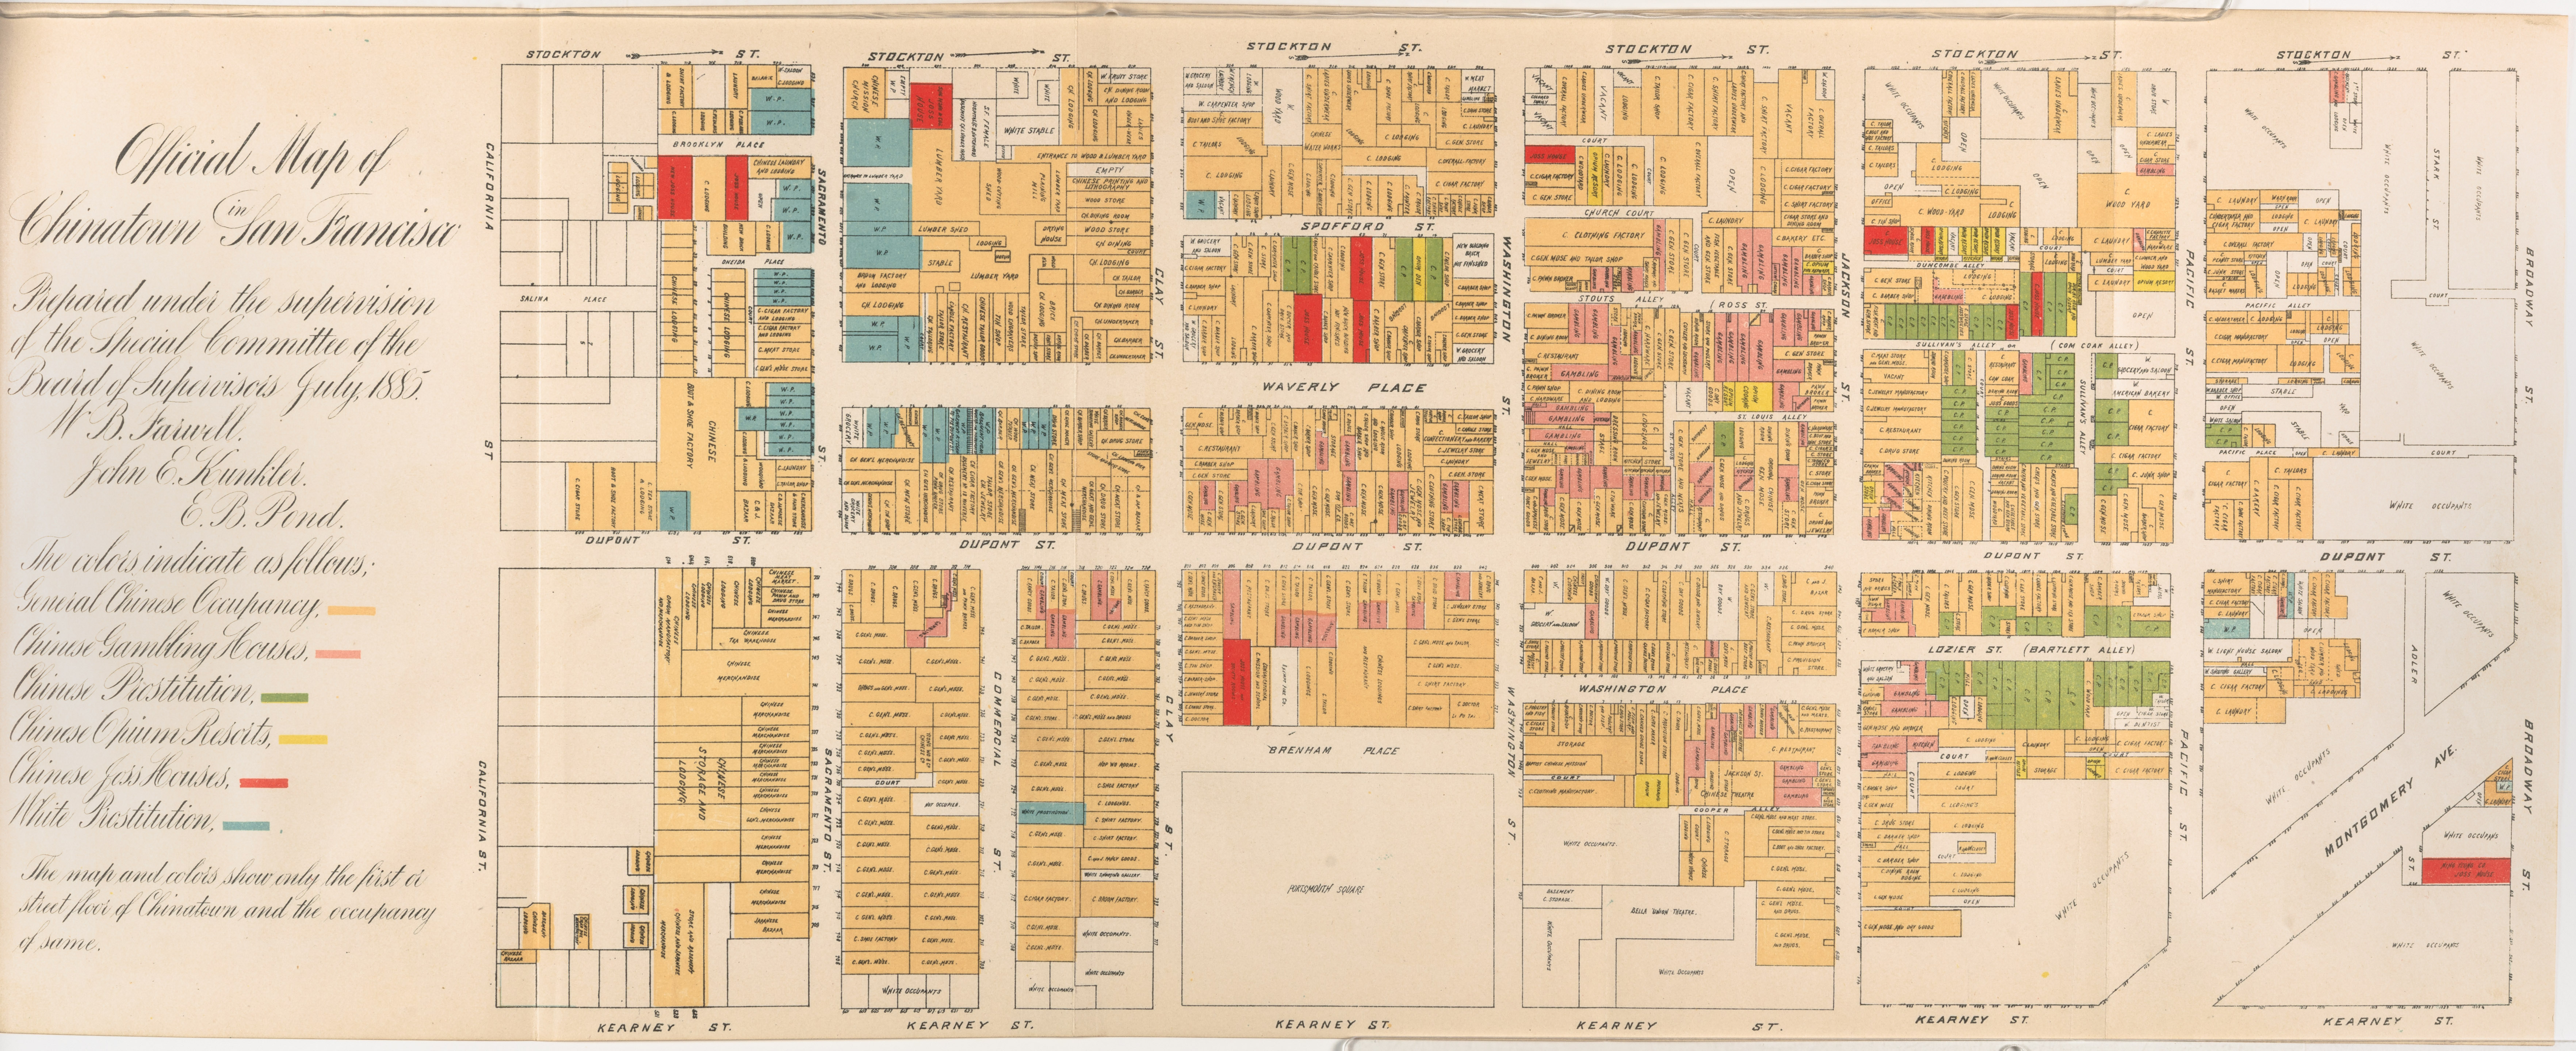
This map reflects the pervasive bias against the Chinese in California and in turn further fostered the hysteria. It was published as part of an official report of a Special Committee established by the San Francisco Board of Supervisors “on the Condition of the Chinese Quarter.” The Report resulted from a dramatic increase in hostility to the Chinese, particularly because many Chinese laborers had been driven out of other Western states by vigilantes and sought safety in San Francisco (Shah 2001, 37).
The substance and tone of the Report is best illustrated by a few excerpts: “The general aspect of the streets and habitations was filthy in the extreme, . . . a slumbering pest, likely at any time to generate and spread disease, . . . a constant source of danger . . . , the filthiest spot inhabited by men, women and children on the American continent.” (Report 4-5). “The Chinese brought here with them and have successfully maintained and perpetuated the grossest habits of bestiality practiced by the human race.” (Ibid. 38).
The map highlights the Committee’s points, particularly the pervasiveness of gambling, prostitution and opium use. It shows the occupancy of the street floor of every building in Chinatown, color coded to show: General Chinese Occupancy, Chinese Gambling Houses, Chinese Prostitution, Chinese Opium Resorts, Chinese Joss Houses, and White Prostitution.
The Report concludes with a recommendation that the Chinese be driven out of the City by stern enforcement of the law: “compulsory obedience to our laws [is] necessarily obnoxious and revolting to the Chinese and the more rigidly this enforcement is insisted upon and carried out the less endurable will existence be to them here, the less attractive will life be to them in California. Fewer will come and fewer will remain. . . . Scatter them by such a policy as this to other States . . . .” (Ibid. 67-68)
2. Analyzing Demographics
In this section, we will examine some of the factors that influence population growth and how they are changing the landscape of Chinatowns across the U.S.
2.1 Reading Data, 2010-2015
Now it’s time to work with tables and explore some real data. A Table is just like how we made a list above with make_array, but for all the rows in a table.
We’re going to first look at the most recent demographic data from 2010-2015:
historical_data = Table.read_table('data/2010-2015.csv')  # read in data from file
historical_data['FIPS'] = ['0' + str(x) for x in historical_data['FIPS']]  # fix FIPS columns
historical_data.show(10)  # show first ten rows
| FIPS | Population | One_race | Two_or_more_races | Asian | Year |
|---|---|---|---|---|---|
| 06075010100 | 3744 | 3689 | 55 | 1276 | 2010 |
| 06075010200 | 4184 | 3942 | 242 | 385 | 2010 |
| 06075010300 | 4285 | 4173 | 112 | 1445 | 2010 |
| 06075010400 | 4154 | 4068 | 86 | 1161 | 2010 |
| 06075010500 | 2429 | 2357 | 72 | 317 | 2010 |
| 06075010600 | 3927 | 3789 | 138 | 2453 | 2010 |
| 06075010700 | 5683 | 5657 | 26 | 4541 | 2010 |
| 06075010800 | 4587 | 4475 | 112 | 2336 | 2010 |
| 06075010900 | 4463 | 4339 | 124 | 1056 | 2010 |
| 06075011000 | 5718 | 5653 | 65 | 3027 | 2010 |
... (1172 rows omitted)
We can get some quick summary statistics by calling the .stats() function on our Table variable:
historical_data.stats()
| statistic | FIPS | Population | One_race | Two_or_more_races | Asian | Year |
|---|---|---|---|---|---|---|
| min | 06075010100 | 0 | 0 | 0 | 0 | 2010 |
| max | 06075990100 | 12511 | 12157 | 660 | 5291 | 2015 |
| median | 4026.5 | 3872 | 157 | 1004 | 2012.5 | |
| sum | 4.88225e+06 | 4.68046e+06 | 201782 | 1.6378e+06 | 2.37878e+06 |
So which census tract has the highest Asian population?
First we can find the highest population by using the max function:
max(historical_data['Asian'])
5291.0
Let’s plug that into a table that uses the where and are.equal_to functions:
historical_data.where('Asian', are.equal_to(max(historical_data['Asian'])))
| FIPS | Population | One_race | Two_or_more_races | Asian | Year |
|---|---|---|---|---|---|
| 06075035300 | 7885 | 7667 | 218 | 5291 | 2014 |
This FIPS code 06075035300 is tract 353. Does this make sense to you?
It might be better to look at which census tracts has Asian as the highest proportion of the population:
historical_data['Asian_percentage'] = historical_data['Asian'] / historical_data['Population']
historical_data.show(5)
| FIPS | Population | One_race | Two_or_more_races | Asian | Year | Asian_percentage |
|---|---|---|---|---|---|---|
| 06075010100 | 3744 | 3689 | 55 | 1276 | 2010 | 0.340812 |
| 06075010200 | 4184 | 3942 | 242 | 385 | 2010 | 0.0920172 |
| 06075010300 | 4285 | 4173 | 112 | 1445 | 2010 | 0.337223 |
| 06075010400 | 4154 | 4068 | 86 | 1161 | 2010 | 0.27949 |
| 06075010500 | 2429 | 2357 | 72 | 317 | 2010 | 0.130506 |
... (1177 rows omitted)
Now we can use the same method to get the max and subset our table:
max(historical_data['Asian_percentage'])
0.9575070821529745
historical_data.where('Asian_percentage', are.equal_to(max(historical_data['Asian_percentage'])))
| FIPS | Population | One_race | Two_or_more_races | Asian | Year | Asian_percentage |
|---|---|---|---|---|---|---|
| 06075011800 | 1765 | 1765 | 0 | 1690 | 2010 | 0.957507 |
FIPS code 06075011800 is census tract 118. Does this make sense?
Replace this text with your response
Tables Essentials!
For your reference, here’s a table of useful Table functions:
| Name | Example | Purpose |
|---|---|---|
Table |
Table() |
Create an empty table, usually to extend with data |
Table.read_table |
Table.read_table("my_data.csv") |
Create a table from a data file |
with_columns |
tbl = Table().with_columns("N", np.arange(5), "2*N", np.arange(0, 10, 2)) |
Create a copy of a table with more columns |
column |
tbl.column("N") |
Create an array containing the elements of a column |
sort |
tbl.sort("N") |
Create a copy of a table sorted by the values in a column |
where |
tbl.where("N", are.above(2)) |
Create a copy of a table with only the rows that match some predicate |
num_rows |
tbl.num_rows |
Compute the number of rows in a table |
num_columns |
tbl.num_columns |
Compute the number of columns in a table |
select |
tbl.select("N") |
Create a copy of a table with only some of the columns |
drop |
tbl.drop("2*N") |
Create a copy of a table without some of the columns |
take |
tbl.take(np.arange(0, 6, 2)) |
Create a copy of the table with only the rows whose indices are in the given array |
join |
tbl1.join("shared_column_name", tbl2) |
Join together two tables with a common column name |
are.equal_to() |
tbl.where("SEX", are.equal_to(0)) |
find values equal to that indicated |
are.not_equal_to() |
tbl.where("SEX", are.not_equal_to(0)) |
find values not including the one indicated |
are.above() |
tbl.where("AGE", are.above(30)) |
find values greater to that indicated |
are.below() |
tbl.where("AGE", are.below(40)) |
find values less than that indicated |
are.between() |
tbl.where("SEX", are.between(18, 60)) |
find values between the two indicated |
2.2 The correlation coefficient - r
If we were interested in the relationship between two variables in our dataset, we’d want to look at correlation.
The correlation coefficient ranges from −1 to 1. A value of 1 implies that a linear equation describes the relationship between X and Y perfectly, with all data points lying on a line for which Y increases as X increases. A value of −1 implies that all data points lie on a line for which Y decreases as X increases. A value of 0 implies that there is no linear correlation between the variables. ~Wikipedia
r = 1: the scatter diagram is a perfect straight line sloping upwards
r = -1: the scatter diagram is a perfect straight line sloping downwards.
Let’s calculate the correlation coefficient between each of the continuous variables in our dataset.. We can use the .to_df().corr() function:
historical_data.to_df().corr()
| Population | One_race | Two_or_more_races | Asian | Year | Asian_percentage | |
|---|---|---|---|---|---|---|
| Population | 1.000000 | 0.998493 | 0.568193 | 0.690292 | 0.053188 | 0.264237 |
| One_race | 0.998493 | 1.000000 | 0.522172 | 0.696641 | 0.043588 | 0.273538 |
| Two_or_more_races | 0.568193 | 0.522172 | 1.000000 | 0.281429 | 0.172941 | 0.002922 |
| Asian | 0.690292 | 0.696641 | 0.281429 | 1.000000 | 0.029201 | 0.839065 |
| Year | 0.053188 | 0.043588 | 0.172941 | 0.029201 | 1.000000 | 0.002954 |
| Asian_percentage | 0.264237 | 0.273538 | 0.002922 | 0.839065 | 0.002954 | 1.000000 |
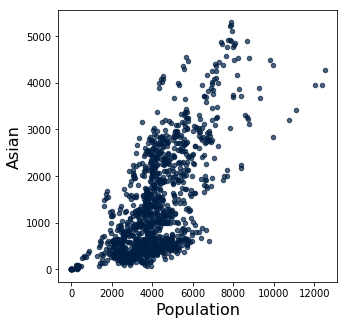
We often visualize correlations with a scatter plot:
historical_data.scatter('Population', 'Asian')
historical_data.scatter('One_race', 'Asian')

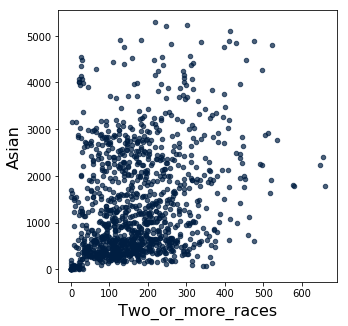
historical_data.scatter('Two_or_more_races', 'Asian')
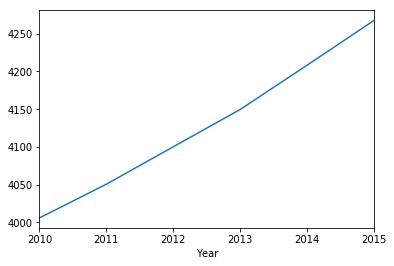
To look at a 1-1 relationship over time we might prefer a simple line graph. We can first group the data by Year, then take the mean for the Population, and plot that against Year:
historical_data.to_df().groupby('Year')['Population'].mean()
Year
2010    4005.949239
2011    4050.675127
2012    4100.279188
2013    4149.751269
2014    4208.487310
2015    4267.832487
Name: Population, dtype: float64
historical_data.to_df().groupby('Year')['Population'].mean().plot()
<matplotlib.axes._subplots.AxesSubplot at 0x1317a5a20>
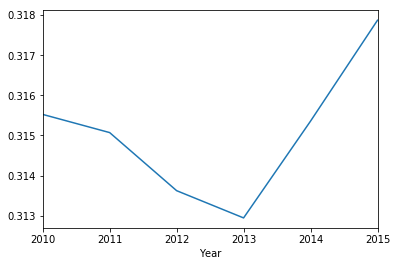
historical_data.to_df().groupby('Year')['Asian_percentage'].mean().plot()
<matplotlib.axes._subplots.AxesSubplot at 0x1318a4f60>
2.3 2015
Let’s look at only the year 2015:
historical_2015 = historical_data.where('Year', are.equal_to(2015))
historical_2015.show(5)
| FIPS | Population | One_race | Two_or_more_races | Asian | Year | Asian_percentage |
|---|---|---|---|---|---|---|
| 06075010100 | 3798 | 3517 | 281 | 1284 | 2015 | 0.338073 |
| 06075010200 | 4172 | 4014 | 158 | 401 | 2015 | 0.096117 |
| 06075010300 | 4387 | 4334 | 53 | 1700 | 2015 | 0.387509 |
| 06075010400 | 5148 | 4709 | 439 | 1429 | 2015 | 0.277584 |
| 06075010500 | 2589 | 2337 | 252 | 804 | 2015 | 0.310545 |
... (192 rows omitted)
We can make a choropleth map with a little function, don’t worry about the code below!
def choro_column(tab, column):
    sf_2010 = geojson.load(open("data/2010-sf.geojson"))
    threshold_scale = np.linspace(min(tab[column]), max(tab[column]), 6, dtype=float).tolist()

    mapa = folium.Map(location=(37.7793784, -122.4063879), zoom_start=11)
    mapa.choropleth(geo_data=sf_2010,
                    data=tab.to_df(),
                    columns=['FIPS', column],
                    fill_color='YlOrRd',
                    key_on='feature.properties.GEOID10',
                    threshold_scale=threshold_scale)

    mapa.save("output/map-{}.html".format(column.replace(" ", "-")))
    return mapa
Here’s a choropleth of all the population:
choro_column(historical_2015, 'Population')
IFrame('output/map-Population.html', width=700, height=400)
Let’s look at only Asian:
choro_column(historical_2015, 'Asian')
Try making one more choropleth below with only Asian_percentage:
Replace this text with your response
Challenge
Replace this text with your response
2.4 1940-2010
Now let’s take a look at the historical data showing how the Asian population has changed over time, as compared to the black population.
First, let’s load in all our of decennial San Francisco Chinatown census data acquired from an online domain called Social Explorer. Let’s first examine this dataset to get a sense of what’s in it.
Replace this text with your response
historical = Table.read_table('data/process.csv')
historical.show(5)
| Asian | Asian and Pacific Islander | Black | Federal Information Processing System Code | Total Population | White | Year |
|---|---|---|---|---|---|---|
| nan | nan | 78 | 06075A0005000 | 3465 | 3199 | 1940 |
| nan | nan | 32 | 06075A0006000 | 4401 | 3203 | 1940 |
| nan | nan | 71 | 06075A0007000 | 5466 | 4489 | 1940 |
| nan | nan | 6 | 06075A0008000 | 5152 | 5124 | 1940 |
| nan | nan | 49 | 06075A0009000 | 5052 | 4959 | 1940 |
... (73 rows omitted)
historical['Other'] = historical['Total Population'] - historical['White'] - historical['Black']
historical.show(5)
| Asian | Asian and Pacific Islander | Black | Federal Information Processing System Code | Total Population | White | Year | Other |
|---|---|---|---|---|---|---|---|
| nan | nan | 78 | 06075A0005000 | 3465 | 3199 | 1940 | 188 |
| nan | nan | 32 | 06075A0006000 | 4401 | 3203 | 1940 | 1166 |
| nan | nan | 71 | 06075A0007000 | 5466 | 4489 | 1940 | 906 |
| nan | nan | 6 | 06075A0008000 | 5152 | 5124 | 1940 | 22 |
| nan | nan | 49 | 06075A0009000 | 5052 | 4959 | 1940 | 44 |
... (73 rows omitted)
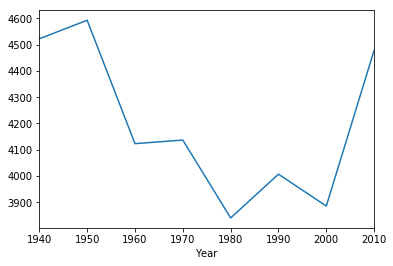
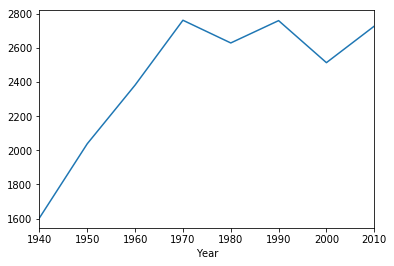
You can use the mean function to find the average total population in Chinatown. Do you notice any significant changes between 1940 and 2010?
historical.to_df().groupby('Year')['Total Population'].mean()
Year
1940    4521.900
1950    4592.400
1960    4123.400
1970    4137.000
1980    3841.100
1990    4007.300
2000    3886.300
2010    4478.125
Name: Total Population, dtype: float64
Let’s plot the results on a graph.
historical.to_df().groupby('Year')['Total Population'].mean().plot()
<matplotlib.axes._subplots.AxesSubplot at 0x12d5f4438>
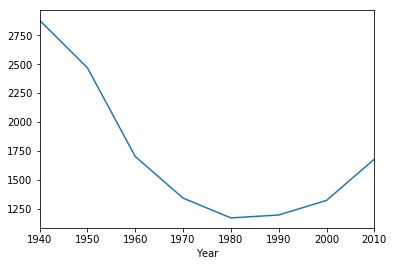
historical.to_df().groupby('Year')['White'].mean()
Year
1940    2880.50
1950    2469.40
1960    1702.10
1970    1341.80
1980    1170.30
1990    1195.60
2000    1322.10
2010    1679.25
Name: White, dtype: float64
We can plot the average population of different racial groups.
historical.to_df().groupby('Year')['White'].mean().plot()
<matplotlib.axes._subplots.AxesSubplot at 0x1329e64e0>
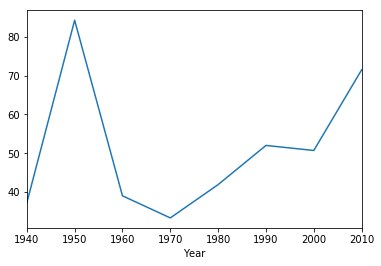
historical.to_df().groupby('Year')['Black'].mean()
Year
1940    37.2
1950    84.3
1960    39.0
1970    33.3
1980    41.9
1990    52.0
2000    50.7
2010    71.5
Name: Black, dtype: float64
historical.to_df().groupby('Year')['Black'].mean().plot()
<matplotlib.axes._subplots.AxesSubplot at 0x1329bcf28>
historical.to_df().groupby('Year')['Other'].mean()
Year
1940    1604.200
1950    2038.700
1960    2382.300
1970    2761.900
1980    2628.900
1990    2759.700
2000    2513.500
2010    2727.375
Name: Other, dtype: float64
historical.to_df().groupby('Year')['Other'].mean().plot()
<matplotlib.axes._subplots.AxesSubplot at 0x132419cf8>
Replace this text with your response
2.5 Manhattan
One of the goals of this module is to compare different Chinatowns from across the US. We will now compare the SF Chinatown data to the census data from Manhattan’s Chinatown. Let’s load the Manhattan data.
manhattan = Table.read_table('data/manhattan_cleaned.csv')
manhattan.show(10)
| Year | Census Tract | Total Population | Asian/Other Population | Chinese Population | White Population |
|---|---|---|---|---|---|
| 1950 | 29 | 6695 | 3180 | 3180 | 6228 |
| 1960 | 29 | 7091 | 4677 | 4677 | 2390 |
| 1970 | 6 | 8322 | 2684 | 2684 | 4669 |
| 1970 | 8 | 9597 | 4258 | 4258 | 5311 |
| 1970 | 16 | 6381 | 4069 | 4069 | 2141 |
| 1970 | 18 | 7764 | 2281 | 2281 | 4766 |
| 1970 | 27 | 1671 | 623 | 623 | 993 |
| 1970 | 29 | 9435 | 5996 | 5996 | 2321 |
| 1970 | 41 | 9294 | 5262 | 5262 | 3845 |
| 1980 | 6 | 10638 | 5172 | 5086 | 2179 |
... (53 rows omitted)
manhattan.to_df().corr()
| Year | Census Tract | Total Population | Asian/Other Population | Chinese Population | White Population | |
|---|---|---|---|---|---|---|
| Year | 1.000000 | 0.054710 | -0.191828 | -0.087767 | -0.118715 | -0.539567 |
| Census Tract | 0.054710 | 1.000000 | -0.412661 | -0.376237 | -0.378750 | -0.014695 |
| Total Population | -0.191828 | -0.412661 | 1.000000 | 0.907103 | 0.904009 | 0.408393 |
| Asian/Other Population | -0.087767 | -0.376237 | 0.907103 | 1.000000 | 0.998946 | 0.119564 |
| Chinese Population | -0.118715 | -0.378750 | 0.904009 | 0.998946 | 1.000000 | 0.123380 |
| White Population | -0.539567 | -0.014695 | 0.408393 | 0.119564 | 0.123380 | 1.000000 |
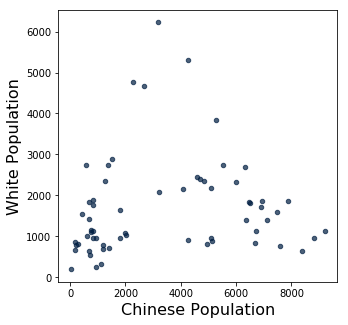
manhattan.scatter('Chinese Population', 'White Population')
manhattan_2010 = manhattan.where('Year', are.equal_to(2010))
manhattan_2010.show()
| Year | Census Tract | Total Population | Asian/Other Population | Chinese Population | White Population |
|---|---|---|---|---|---|
| 2010 | 2.01 | 3058 | 1266 | 1202 | 777 |
| 2010 | 6 | 11367 | 7253 | 6886 | 1708 |
| 2010 | 8 | 10290 | 9069 | 8832 | 964 |
| 2010 | 14.02 | 2782 | 880 | 760 | 1142 |
| 2010 | 16 | 8478 | 7058 | 6733 | 1117 |
| 2010 | 18 | 8660 | 5281 | 4827 | 2338 |
| 2010 | 22.01 | 6398 | 1553 | 1267 | 2349 |
| 2010 | 25 | 4869 | 1919 | 1818 | 965 |
| 2010 | 27 | 1264 | 978 | 941 | 254 |
| 2010 | 29 | 6398 | 4461 | 4260 | 917 |
| 2010 | 30.01 | 4492 | 1029 | 592 | 2732 |
| 2010 | 31 | 2550 | 712 | 413 | 1550 |
| 2010 | 36.01 | 3393 | 852 | 678 | 1424 |
| 2010 | 41 | 7817 | 5015 | 4598 | 2445 |
| 2010 | 43 | 4270 | 1046 | 827 | 1750 |
| 2010 | 45 | 1136 | 230 | 176 | 851 |
def choro_column(tab, column):
    tab = tab.to_df()
    tab['Census Tract'] = tab['Census Tract'].astype(str).str.strip('0').str.strip('.')
    nyc_2010 = geojson.load(open("data/nyc-census-2010.geojson"))
    tracts = folium.features.GeoJson(nyc_2010)
    threshold_scale = np.linspace(min(tab[column]), max(tab[column]), 6, dtype=float).tolist()

    mapa = folium.Map(location=(40.7128, -74.00609), zoom_start=11)
    mapa.choropleth(geo_data=nyc_2010,
                    data=tab,
                    columns=['Census Tract', column],
                    fill_color='YlOrRd',
                    key_on='feature.properties.CTLabel',
                    threshold_scale=threshold_scale)
    mapa.save("output/map-{}.html".format(column.replace(" ", "-")))
    return mapa
choro_column(manhattan_2010, 'Chinese Population')
IFrame('output/map-Chinese-Population.html', width=700, height=400)
manhattan_2010['Asian_percentage'] = manhattan_2010['Asian/Other Population'] / manhattan_2010['Total Population']
manhattan_2010.show(5)
| Year | Census Tract | Total Population | Asian/Other Population | Chinese Population | White Population | Asian_percentage |
|---|---|---|---|---|---|---|
| 2010 | 2.01 | 3058 | 1266 | 1202 | 777 | 0.413996 |
| 2010 | 6 | 11367 | 7253 | 6886 | 1708 | 0.638075 |
| 2010 | 8 | 10290 | 9069 | 8832 | 964 | 0.881341 |
| 2010 | 14.02 | 2782 | 880 | 760 | 1142 | 0.316319 |
| 2010 | 16 | 8478 | 7058 | 6733 | 1117 | 0.832508 |
... (11 rows omitted)
choro_column(manhattan_2010, 'Asian_percentage')
IFrame('output/map-Asian_percentage.html', width=700, height=400)
3. Reading Primary Texts
In this class, we have been learning how to ‘close-read’ primary texts. Close-reading generally involves picking select passages and reading for the latent meanings embedded in word choice, syntax, the use of metaphors and symbols, etc. Here, we are introducing another way of analyzing primary texts using computational methods. Computational text analysis generally involves ‘counting’ words. Let’s see how this works by analyzing some of the poems written by Chinese immigrants on Angel Island.
Run the following cell to import the poems from a .txt file.
with open('data/islandpoetry1_22.txt', "r") as f:
    raw = f.read()
print(raw)
The sea-scape resembles lichen twisting and
turning for a thousand li
There is no shore to land and it is difficult to
walk.
With a gentle breeze I arrived at the city
thinking all would be so.
At ease, how was one to know he was to live in a
wooden building?

Because my house had bare walls, I began
rushing all about.
The waves are happy, laughing "Ha-ha!"
When I arrived on Island, I heard I was
forbidden to land.
I could do nothing but frown and feel angry
at heaven.

As a rule, a person is twenty before he starts
making a living.
Family circumstances have forced me to
experience wind and dust.
The heartless months and years seem bent on
defeating me.
It is a pity that time quickly ages one.

The gold and silver of America is very
appealing.
Jabbing an awl into the thigh in search of
glory,
I embarked on the journey.
Not only are my one-thousand pieces of gold
already depleted, but
My countenance is blackened. It is surely for
the sake of the family.

Four days before the Qiqiao Festival,
I boarded the steamship for America.
Time flew like a shooting arrow.
Already, a cool autumn has passed.
Counting on my fingers, several months have
elapsed.
Still I am at the beginning of the road.
I have yet to be interrogated.
My heart is nervous with anticipation.

Everyone says travelling to North America is
a pleasure.
I suffered misery on the ship and sadness in
the wooden building.
After several interrogations, still I am not
done.
I sigh because my compatriots are being
forceably detained.

Originally, I had intended to come to
America last year.
Lack of money delayed me until early
autumn.
It was on the day that the Weaver Maiden
met the Cowherd
That I took passage on the President Lincoln.
I ate wind and tasted waves for more than
twenty days.
Fortunately, I arrived safely on the American
continent.
I thought I could land in a few days.
How was I to know I would become a
prisoner suffering in the wooden building?
The barbarians' abuse is really difficult to
take.
When my family's circumstances stir my
emotions, a double stream of tears flow.
I only wish I can land in San Francisco soon.
Thus sparing me this additional sorrow here.

Instead of remaining a citizen of China, I
willingly became an ox.
I intended to come to America to earn a
living.
The Western styled buildings are lofty; but I
have not the luck to live in them.
How was anyone to know that my dwelling
place would be a prison?

I used to admire the land of the Flowery
Flag as a country of abundance.
I immediately raised money and started my
journey.
For over a month, I have experienced enough
winds and waves.
Now on an extended sojourn in jail, I am
subject to the ordeals of prison life.
I look up and see Oakland so close by.
I wish to go back to my motherland to carry
the farmer's hoe.
Discontent fills my belly and it is difficult for
me to sleep.
I just write these few lines to express what is
on my mind.

Just talk about going to the land of the
Flowery Flag and my countenance fills
with happiness.
Not without hard work were 1,000 pieces of
gold dug up and gathered together.
There were words of farewell to the parents,
but the throat choked up first.
There were many feelings, many tears flowing
face to face, when parting with the wife.
Waves big as mountains often astonished this
traveller.
With laws harsh as tigers, I had a taste of all
the barbarities.
Do not forget this day when you land ashore.
Push yourself ahead and do not be lazy or
idle.

I think back on the past when I had not
experienced hardship.
I resolved to go and seek Taogong.
The months and years are wasted and still it
has not ended.
Up to now, I am still trapped on a lonely
island.

Today is the last day of winter.
Tomorrow morning is the vernal equinox.
One year's prospects have changed to another.
Sadness kills the person in the wooden
building.

In the quiet of night, I heard, faintly, the
whistling of wind.
The forms and shadows saddened me, upon
seeing the landscape, I composed a poem.
The floating clouds, the fog, darken the sky.
The moon shines faintly as the insects chirp.
Grief and bitterness entwined are heaven sent.
The sad person sits alone, leaning by a window.

The night is cool as I lie stiff on the steel bunk.
Before the window the moon lady shines on me.
Bored, I get up and stand beneath the cold
window.
Sadly, I count the time that's elapsed.
It is already mid-autumn.
We should all honor and enjoy her.
But I have not prepared even the most trifling
gift and I feel embarrassed.

The insects chirp outside the four walls.
The inmates often sigh.
Thinking of affairs back home.
Unconscious tears wet my lapel.

Depressed from living on Island, I sought the
Sleeping Village.
The uncertain future altogether wounds my
spirit.
When I see my old country fraught with chaos,
I, a drifting leaf, become doubly saddened.

My belly is so full of discontent it is really
difficult to relax.
I can only worry silently to myself.
At times I gaze at the cloud- and fog-enshrouded
mountain-front.
It only deepens my sadness.

Sadly, I listen to the sounds of insects and
angry surf.
The harsh laws pile layer upon layer; how
can I dissipate my hatred?
Drifting in as a traveller, I met with this
calamity.
It is more miserable than owning only a flute
in the marketplace of Wu.

Living on Island away from home elicits a
hundred feelings.
My chest is filled with a sadness and anger I
cannot bear to explain.
Night and day, I sit passively and listlessly.
Fortunately, I have a novel as my companion.

Imprisonment at Youli, when will it end?
Fur and linen garments have been exchanged;
it is already another autumn.
My belly brims with discontent, too numerous
to inscribe on bamboo slips.
Snow falls, flowers wilt, expressing sorrow
through the ages.

The west wind ruffles my thin gauze clothing.
On the hill sits a tall building with a room of
wooden planks.
I wish I could travel on a cloud far away,
reunite with my wife and son.
When the moonlight shines on me alone, the
nights seem even longer.
At the head of the bed there is wine and my
heart is constantly drunk.
There is no flower beneath my pillow and
my dreams are not sweet.
To whom can I confide my innermost
feelings?
I rely solely on close friends to relieve my
loneliness.

America has power, but not justice.
In prison, we were victimized as if we were
guilty.
Given no opportunity to explain, it was really
brutal.
I bow my head in reflection but there is
nothing I can do.

This place is called an island of immortals.
When, in fact, this mountain wilderness is a
prison.
Once you see the open net, why throw
yourself in?
It is only because of empty pockets I can do
nothing else.

I, a seven foot man, am ashamed I cannot
extend myself.
Curled up in an enclosure, my movements
are dictated by others."
Enduring a hundred humiliations, I can only
cry in vain.
This person's tears fall, but what can the blue
heavens do?

I have infinite feelings that the ocean
has changed into a mulberry grove.
My body is detained in this building.
I cannot fly from this grassy hill.
And green waters block the hero.
Impetuously, I threw away my writing brush.
My efforts have all been in vain.
It is up to me to answer carefully.
I have no words to murmur against the east
wind.

My grief, like dense clouds, cannot be
dispersed.
Whether deliberating or being melancholy
and bored,
I constantly pace to and fro.
Wang Can ascended the tower but who
pitied his sorrow?
Lord Yu who left his country could only wail
to himself.

Over a hundred poems are on the walls.
Looking at them, they are all pining at the
delayed progress.
What can one sad person say to another?
Unfortunate travellers everywhere wish to
commiserate.
Gain or lose, how is one to know what is
predestined?
Rich or poor, who is to say it is not the will
of heaven?
Why should one complain if he is detained
and imprisoned here?
From ancient times, heroes often were the
first ones to face adversity.

The male eagle is also easy to tame.
One must be able to bend before one can
stretch.
China experienced calamities for a thousand
years.
Confucius was surrounded in Chen for seven
days.
Great men exhibit quality.
Scholars take pride in being themselves.
Gains and losses are entangled in my bosom.
My restlessness is a sign of self-illumination.

Half way up the hill on Island, in the
building upstairs.
The imprisoned one has been separated from
his people summer to autumn.
Three times I dreamed of returning to the
native village.
My intestines are agitated in its nine turns by
the false Westerner.
I have run into hard times and am uselessly
depressed.
There are many obstacles in life but who will
commiserate with me?
If at a later time I am allowed to land on the
American shore,
I will toss all the miseries of this jail to the
flowing current.

After leaping into prison, I cannot come out.
From endless sorrows, tears and blood streak.
The jingwei bird carries gravel to fill its old
grudge.
The migrating wild goose complains to the
moon, mourning his harried life.
When Ziqing was in distant lands, who
pitied and inquired after him?
When Ruan Ji reached the end of the road,
he shed tile tears.
The scented grass and hidden orchids
complain of withering and falling.
When can I be allowed to rise above as I
please?

There are tens of thousands of poems
composed on these walls.
They are all cries of complaint and sadness.
The day I am rid of this prison and attain
success,
I must remember that this chapter once
existed.
In my daily needs, I must be frugal.
Needless extravagance leads youth to ruin.
All my compatriots should please be mindful.
Once you have some small gains, return
home early.

Imprisoned in the wooden building day after
day.
My freedom withheld; how can I bear to talk
about it?
I look to see who is happy but they only sit
quietly.
I am anxious and depressed and cannot fall
asleep.
The days are long and the bottle constantly
empty; my sad mood, even so, is not
dispelled.
Nights are long and the pillow cold; who can
pity my loneliness?
After experiencing such loneliness and sorrow.
Why not just return home and learn to plow
the fields?

A building does not have to be tall; if it has
windows, it will be bright.
Island is not far, Angel Island.
Alas, this wooden building disrupts my
travelling schedule.
Paint on the four walls are green.
And green is the grass which surrounds.
It is noisy because of the many country folk.
And there are watchmen guarding during the
night.
To exert influence, one can use a square-holed
elder brother.
There are children who disturb the ears.
But there are no incoherent sounds that
cause fatigue.
I gaze to the south at the hospital,
And look to the west at the army camp.
This author says, "What happiness is there in
this?

For what reason must I sit in jail?
It is only because my country is weak and
my family poor.
My parents wait at the door but there is no
news.
My wife and child wrap themselves in quilt,
sighing with loneliness.
Even if my petition is approved and I can
enter the country.
When can I return to the Mountains of Tang
with a full load?
From ancient times, those who venture out
usually become worthless.
How many people ever return from battles?


Leaving behind my writing brush and
removing my sword, I came to America.
Who was to know two streams of tears would
flow upon arriving here?
If there comes a day when I will have
attained my ambition and become
successful,
I will certainly behead the barbarians and
spare not a single blade of grass.

I am a member of the Huang clan from
Xiangcheng.
I threw away my writing brush and pushed
forward, journeying to the capital of the
U.S.
I bought an oar and arrived in the land of the
Golden Mountain.
Who was to know they would banish me to
Island?
If my country had contrived to make herself
strong, this never would have happened.
Then when the ship had docked, we could
have gone directly ashore.

Just now the five nationalities in China have
become one family,
But the powers still have not yet recognized
our China,
Primarily because foreign debts were piling
up.
The foreigners pushed to control finances
and to seize power.

Being idle in the wooden building, I opened
a window.
The morning breeze and bright moon lingered
together.
I reminisce the native village far away, cut off
by clouds and mountains.
On the little island the wailing of cold, wild
geese can be faintly heard.
The hero who has lost his way can talk
meaninglessly of the sword.
The poet at the end of the road can only
ascend a tower.
One should know that when the country is
weak, the people's spirit dies.
Why else do we come to this place to be
imprisoned?

Twice I have passed through the blue ocean,
experienced the wind and dust of journey.
Confinement in the wooden building has
pained me doubly.
With a weak country, we must all join
together in urgent effort.
It depends on all of us together to roll back
the wild wave.

I lean on the railing and lift my head to look
at the cloudy sky.
All the mountains and rivers are dark.
Eastern Mongolia is lost and the date of her
return is uncertain.
The recovery of the Central Plains depends
on the youth.
Only the tongue of Changshan can slay the
villainous.
To kill the bandit we must wave the whip of
Zu Di.
I am ashamed to be curled up like a worm
on Island.
I grieve for my native land but what else can
I say?

I have ten-thousand hopes that the
revolutionary armies will complete their
victory.
And help make the mining enterprises
successful in the ancestral land.
They will build many battleships and come to
the U.S. territory.
Vowing never to stop till the white men are
completely annihilated.

The dragon out of water is humiliated by
ants;
The fierce tiger who is caged is baited by a
child.
As long as I am imprisoned, how can I dare
strive for supremacy?
An advantageous position for revenge will
surely come one day.

I left the village well behind me, bade
farewell to my father and mother.
Now I gaze at distant clouds and mountains,
tears forming like pearls.
The wandering son longed to be wealthy like
Taozhu.
Who would have known I would be
imprisoned on Island?
I beat my breast when I think of China and
cry bitterly like Ruan Ji.
Our country's wealth is being drained by
foreigners, causing us to suffer national
humiliations.
My fellow countrymen, have foresight, plan
to be resolute.
And vow to conquer the U.S. and avenge
previous wrongs!

If the land of the Flowery Flag is occupied by
us in turn.
The wooden building will be left for the
angel's revenge.

If you have but one breath left, do not be
discouraged from your purpose.
I respectfully exhort my brothers who are all
talents of Chu.
Having a sense of shame, one can eradicate
shame.
Only by wielding the lance can one avoid
certain defeat.
Do not say that we have not the means to
level the ugly barbarians.
I am searching for a method that will turn
destiny back.
One-hundred-thousand men sharpen their
swords.
Swearing to behead the Loulan and open
the grasslands and fallow fields.

The low building with three beams merely
shelters the body.
It is unbearable to relate the stories
accumulated on the Island slopes.
Wait till the day I become successful and
fulfill my wish!
I will not speak of love when I level the
immigration station!

I am distressed that we Chinese are detained
in this wooden building.
It is actually racial barriers which cause
difficulties on Yingtai Island.
Even while they are tyrannical, they still
claim to be humanitarian.
I should regret my taking the risks of coming
in the first place.

I thoroughly hate the barbarians because they
do not respect justice.
They continually promulgate harsh laws to
show off their prowess.
They oppress the overseas Chinese and also
violate treaties.
They examine for hookworms and practice
hundreds of despotic acts.

I cannot bear to describe the harsh treatment
by the doctors.
Being stabbed for blood samples and
examined for hookworms was even more
pitiful.
After taking the medicine, I also drank
liquid,
Like a dumb person eating the huanglian.
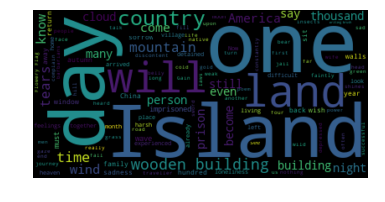
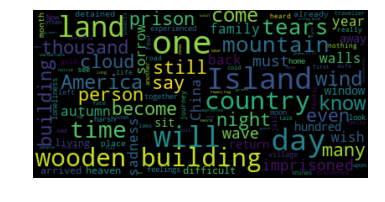
We’re interested in which words appear the most often in our set of poems. It’s pretty hard to read or see much in this form. We’ll coming back to the topic of what words are the most common with actual numbers a bit later but for now, run the following cell to generate two interesting visualizations of the most common words (minus those such as “the”, “a”, etc.).
wordcloud = WordCloud().generate(raw)

plt.imshow(wordcloud, interpolation='bilinear')
plt.axis("off")

# lower max_font_size
wordcloud = WordCloud(max_font_size=40).generate(raw)
plt.figure()
plt.imshow(wordcloud, interpolation="bilinear")
plt.axis("off")
plt.show()
Replace this text with your response
Oops, it seems we’ve forgotten just how many poems we have in our set. Luckily we have a quick way of finding out! Each “\n” in the display of the poem text indicates a line break. It turns out that each poem is separated by an empty line, a.k.a. two line breaks or “\n”’s.
num_poems = len(raw.split("\n\n"))
num_poems
49
We can also use this idea to calculate the number of characters in each poem.
num_char_per_poem = [len(p) for p in raw.split("\n\n")]
print(num_char_per_poem)
[259, 212, 227, 262, 306, 233, 654, 260, 488, 550, 206, 167, 331, 325, 128, 203, 196, 251, 221, 250, 488, 201, 206, 237, 344, 243, 442, 345, 507, 474, 382, 465, 624, 444, 302, 399, 230, 505, 268, 437, 288, 226, 532, 116, 487, 254, 279, 263, 233]
This is interesting but seems like just a long list of numbers. What about the average number of characters per poem?
np.mean(num_char_per_poem)
325.51020408163265
Let’s look at it in histogram form to get a better idea of our data.
Table().with_columns("Character Count", np.asarray(num_char_per_poem)).hist()
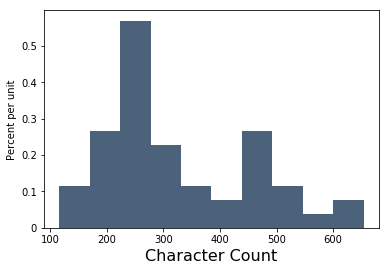
Each bar of this histogram tells us what proportion of the poems (the height of the bar) have that many characters (the position of the bar on the x-axis).
We can also use “\n” to look at enjambment too. Let’s calculate the proportion of lines that are enjambed out of the total number of lines per poem.
from string import punctuation

poems = raw.split("\n\n")

all_poems_enjambment = []
for p in poems:
    lines = p.split("\n")
    poems = raw.split("\n\n")
    enjambment = 0
    for l in lines:
        try:
            if l[-1] in punctuation:
                pass
            else:
                enjambment += 1
        except:
            pass
    enj = enjambment/len(lines)
    all_poems_enjambment.append(enj)

print(all_poems_enjambment)
[0.625, 0.42857142857142855, 0.42857142857142855, 0.5555555555555556, 0.1111111111111111, 0.5, 0.45, 0.5, 0.4666666666666667, 0.4375, 0.42857142857142855, 0.2, 0.25, 0.2222222222222222, 0.0, 0.3333333333333333, 0.3333333333333333, 0.5, 0.3333333333333333, 0.2857142857142857, 0.4, 0.42857142857142855, 0.42857142857142855, 0.5, 0.2, 0.4444444444444444, 0.42857142857142855, 0.2727272727272727, 0.5, 0.35714285714285715, 0.3333333333333333, 0.5, 0.3157894736842105, 0.35714285714285715, 0.5, 0.5384615384615384, 0.5, 0.5, 0.375, 0.4666666666666667, 0.5555555555555556, 0.5, 0.47058823529411764, 0.5, 0.5, 0.5, 0.5, 0.5, 0.4444444444444444]
Once again, what about the average?
np.mean(all_poems_enjambment)
0.41237745084889205
Let’s now return to the question of the words that appear the most frequently in these 49 poems. First we have to use spaCy, an open-source software library for Natural Language Processing (NLP), to parse through the text and replace all the “\n”’s with spaces.
nlp = spacy.load('en', parser=False)
parsed_text = nlp(raw.replace("\n", " "))
We can separate all the words/symbols and put them in a table.
toks_tab = Table()
toks_tab.append_column(label="Word", values=[word.text for word in parsed_text])
toks_tab
| Word |
|---|
| The |
| sea |
| - |
| scape |
| resembles |
| lichen |
| twisting |
| and |
| turning |
| for |
... (3366 rows omitted)
toks_tab.append_column(label="POS", values=[word.pos_ for word in parsed_text])
toks_tab
| Word | POS |
|---|---|
| The | DET |
| sea | NOUN |
| - | PUNCT |
| scape | NOUN |
| resembles | NOUN |
| lichen | ADJ |
| twisting | VERB |
| and | CCONJ |
| turning | VERB |
| for | ADP |
... (3366 rows omitted)
Now let’s create a new table with even more columns using the “tablefy” function below.
def tablefy(parsed_text):
    toks_tab = Table()
    toks_tab.append_column(label="Word", values=[word.text for word in parsed_text])
    toks_tab.append_column(label="POS", values=[word.pos_ for word in parsed_text])
    toks_tab.append_column(label="Lemma", values=[word.lemma_ for word in parsed_text])
    toks_tab.append_column(label="Stop Word", values=[word.is_stop for word in parsed_text])
    toks_tab.append_column(label="Punctuation", values=[word.is_punct for word in parsed_text])
    toks_tab.append_column(label="Space", values=[word.is_space for word in parsed_text])
    toks_tab.append_column(label="Number", values=[word.like_num for word in parsed_text])
    toks_tab.append_column(label="OOV", values=[word.is_oov for word in parsed_text])
    toks_tab.append_column(label="Dependency", values=[word.dep_ for word in parsed_text])
    return toks_tab
tablefy(parsed_text)
| Word | POS | Lemma | Stop Word | Punctuation | Space | Number | OOV | Dependency |
|---|---|---|---|---|---|---|---|---|
| The | DET | the | True | False | False | False | True | det |
| sea | NOUN | sea | False | False | False | False | True | compound |
| - | PUNCT | - | False | True | False | False | True | punct |
| scape | NOUN | scape | False | False | False | False | True | nsubj |
| resembles | NOUN | resemble | False | False | False | False | True | ROOT |
| lichen | ADJ | lichen | False | False | False | False | True | compound |
| twisting | VERB | twist | False | False | False | False | True | dobj |
| and | CCONJ | and | True | False | False | False | True | cc |
| turning | VERB | turn | False | False | False | False | True | conj |
| for | ADP | for | True | False | False | False | True | prep |
... (3366 rows omitted)
Next, let’s look at the frequency of words. However, we want to get rid of words such as “the” and “and” (stop words), punctuation, and spaces. We can do this by selecting rows that are not stop words, punctuation, or spaces and then sorting by word!
word_counts = tablefy(parsed_text).where("Stop Word", are.equal_to(False)).where(
    "Punctuation", are.equal_to(False)).where(
    "Space", are.equal_to(False)).group("Word").sort("count",descending=True)
word_counts
| Word | count |
|---|---|
| building | 15 |
| land | 12 |
| wooden | 11 |
| Island | 11 |
| day | 10 |
| country | 10 |
| tears | 8 |
| know | 7 |
| America | 7 |
| wind | 6 |
... (899 rows omitted)
In this table, we have both the words “sad” and “sadness” - it seems strange to separate them. It turns out that these words are part of the same “lexeme”, or a unit of meaning. For example, “run”, “runs”, “ran”, and “running” are all part of the same lexeme with the lemma ‘run’. Lemmas are another column in our table from above! Nice!
lemma_counts = tablefy(parsed_text).where("Stop Word", are.equal_to(False)).where(
    "Punctuation", are.equal_to(False)).where(
    "Space", are.equal_to(False)).group("Lemma").sort("count",descending=True)
lemma_counts
| Lemma | count |
|---|---|
| building | 16 |
| day | 15 |
| land | 13 |
| wooden | 11 |
| country | 10 |
| Island | 10 |
| come | 9 |
| time | 8 |
| tear | 8 |
| know | 8 |
... (796 rows omitted)
Now let’s look at how many words there are of each part of speech.
pos_counts = tablefy(parsed_text).where("Stop Word", are.equal_to(False)).where(
    "Punctuation", are.equal_to(False)).where(
    "Space", are.equal_to(False)).group("POS").sort("count",descending=True)
pos_counts
| POS | count |
|---|---|
| NOUN | 585 |
| VERB | 392 |
| ADJ | 173 |
| PROPN | 85 |
| ADV | 65 |
| ADP | 12 |
| NUM | 8 |
| INTJ | 1 |
We can also look at the proportions of each POS out of all the words!
for i in np.arange(pos_counts.num_rows):
    pos = pos_counts.column("POS").item(i)
    count = pos_counts.column("count").item(i)
    total = np.sum(pos_counts.column("count"))
    proportion = str(count / total)
    print(pos + " proportion: " + proportion)
NOUN proportion: 0.4428463285389856
VERB proportion: 0.2967448902346707
ADJ proportion: 0.13096139288417866
PROPN proportion: 0.0643451930355791
ADV proportion: 0.04920514761544285
ADP proportion: 0.009084027252081756
NUM proportion: 0.006056018168054504
INTJ proportion: 0.000757002271006813
If we’re interested in words’ relations with each other, we can look at words that are next to each other. The function below returns the word following the first instance of the word you search for in the specified source.
def nextword(word, source):
    for i, w in enumerate(source):
        if w == word:
            return source[i+1]
Mess around a bit with this function! Change the “word” argument.
split_txt = raw.split()

# Change the target or "home" to other words!
nextword("home", split_txt)
'elicits'
We are specifically interested in the word “I” and the words that poets use in succession. Let’s make an array of all the words that come after it in these poems. For easier viewing, the phrases have been printed out. What do you notice?
one_after_i = make_array()
for i, w in enumerate(split_txt):
    if w == "I":
        one_after_i = np.append(one_after_i, split_txt[i+1])
for i in one_after_i:
    print("I " + i)
I arrived
I began
I arrived
I heard
I was
I could
I embarked
I boarded
I am
I have
I suffered
I am
I sigh
I had
I took
I ate
I arrived
I thought
I could
I to
I would
I only
I can
I willingly
I intended
I have
I used
I immediately
I have
I am
I look
I wish
I just
I had
I think
I had
I resolved
I am
I heard,
I composed
I lie
I get
I count
I have
I feel
I sought
I see
I can
I gaze
I listen
I dissipate
I met
I cannot
I sit
I have
I wish
I could
I confide
I rely
I bow
I can
I can
I cannot
I can
I have
I cannot
I threw
I have
I constantly
I dreamed
I have
I am
I will
I cannot
I be
I please?
I am
I must
I must
I bear
I look
I am
I gaze
I sit
I can
I return
I came
I will
I will
I am
I threw
I bought
I opened
I reminisce
I have
I lean
I am
I grieve
I say?
I have
I am
I dare
I left
I gaze
I would
I beat
I think
I respectfully
I am
I become
I will
I level
I am
I should
I thoroughly
I cannot
I also
Above we have only shown the next word, what about the next two words? Does this give you any new insight?
two_after_i = make_array()
for i, w in enumerate(split_txt):
    if w == "I":
        two_after_i = np.append(two_after_i, split_txt[i+1] + " " + split_txt[i+2])
for i in two_after_i:
    print("I " + i)
I arrived at
I began rushing
I arrived on
I heard I
I was forbidden
I could do
I embarked on
I boarded the
I am at
I have yet
I suffered misery
I am not
I sigh because
I had intended
I took passage
I ate wind
I arrived safely
I thought I
I could land
I to know
I would become
I only wish
I can land
I willingly became
I intended to
I have not
I used to
I immediately raised
I have experienced
I am subject
I look up
I wish to
I just write
I had a
I think back
I had not
I resolved to
I am still
I heard, faintly,
I composed a
I lie stiff
I get up
I count the
I have not
I feel embarrassed.
I sought the
I see my
I can only
I gaze at
I listen to
I dissipate my
I met with
I cannot bear
I sit passively
I have a
I wish I
I could travel
I confide my
I rely solely
I bow my
I can do.
I can do
I cannot extend
I can only
I have infinite
I cannot fly
I threw away
I have no
I constantly pace
I dreamed of
I have run
I am allowed
I will toss
I cannot come
I be allowed
I please? There
I am rid
I must remember
I must be
I bear to
I look to
I am anxious
I gaze to
I sit in
I can enter
I return to
I came to
I will have
I will certainly
I am a
I threw away
I bought an
I opened a
I reminisce the
I have passed
I lean on
I am ashamed
I grieve for
I say? I
I have ten-thousand
I am imprisoned,
I dare strive
I left the
I gaze at
I would be
I beat my
I think of
I respectfully exhort
I am searching
I become successful
I will not
I level the
I am distressed
I should regret
I thoroughly hate
I cannot bear
I also drank
Try doing some exploring of your own! If you’re feeling stuck, feel free to copy and edit code from above.
# Write your own code here!
Sentiment Analysis
We can do some analysis of the overall sentiments, or emotions conveyed, in each of the poems using the code below. Here, we analyze the overall sentiment of each poem individually. Once you run the next cell, you’ll see the sentiment values for each poem. A value below 0 denotes a negative sentiment, and a value above 0 is positive.
sentiments = make_array()
for p in poems:
    poem = TextBlob(p)
    sentiments = np.append(sentiments, poem.sentiment.polarity)
sentiments
array([-0.04090909,  0.18333333, -0.02222222,  0.38333333,  0.175     ,
        0.        ,  0.09791667,  0.12878788, -0.02380952,  0.15104167,
       -0.19166667,  0.        , -0.46      , -0.08061224, -0.03333333,
        0.03333333, -0.03      , -0.28333333,  0.03333333,  0.        ,
       -0.195     , -0.6875    , -0.025     ,  0.        ,  0.16666667,
       -0.26      , -0.155     ,  0.38611111, -0.10083333, -0.03194444,
       -0.10833333, -0.07727273,  0.12777778, -0.134375  ,  0.15      ,
        0.08333333,  0.1375    , -0.12625   ,  0.075     , -0.05      ,
        0.29      ,  0.225     , -0.05138889,  0.        ,  0.00204082,
        0.265625  ,  0.0625    , -0.33333333, -0.025     ])
Now, what does this mean? It appears that the number of poems with negative sentiment is about the same as the number of poems with positive or neutral (0) sentiment. We can look at the proportion of negative poems in the next cell:
neg_proportion = np.count_nonzero(sentiments < 0)/len(sentiments)
neg_proportion
0.4897959183673469
Okay, so just under half of the poems have negative sentiment. So, on average the poems have slightly positive sentiment, right?
We can also perform sentiment analysis across the text of all of the poems at once and see what happens:
poems_all = TextBlob(raw.replace('\n', ' '))
poems_all.sentiment.polarity
-0.014875449409347723
This way of analyzing the text tells us that the language in all of the poems has slightly negative sentiment.
One more analysis we can perform is computing the average sentiment of the poems, given the list of each individual poem’s sentiments that we computed earlier:
np.mean(sentiments)
-0.007540473981800516
This method also tells us that our poems have slightly negative sentiment, on average.
Here, let’s look at one of the poems with it’s sentiment value:
poem_3 = poems[3].replace('\n', ' ')
print(poem_3)
print(TextBlob(poem_3).sentiment.polarity)
The gold and silver of America is very appealing. Jabbing an awl into the thigh in search of glory, I embarked on the journey. Not only are my one-thousand pieces of gold already depleted, but My countenance is blackened. It is surely for the sake of the family.
0.3833333333333333
Let’s look at one more poem:
poem_47 = poems[47].replace('\n', ' ')
print(poem_47)
print(TextBlob(poem_47).sentiment.polarity)
I thoroughly hate the barbarians because they do not respect justice. They continually promulgate harsh laws to show off their prowess. They oppress the overseas Chinese and also violate treaties. They examine for hookworms and practice hundreds of despotic acts.
-0.3333333333333333
Replace this text with your response