Regex in pandas
Everything we did with re on a single string, pandas can do to a whole column through the .str accessor. That is where regular expressions pay off in data work: one pattern cleans, splits, or recodes thousands of rows at once. This page walks through the main .str regex methods and then puts them to work on a real dataset of restaurant inspections.
import pandas as pd
import re
Finding every match with .str.findall
.str.findall runs re.findall on each row and returns a Series of lists. Here is a column of strings, some of which contain SSNs.
df_ssn = pd.DataFrame(
    ["987-65-4321", "forty", "123-45-6789 or 321-45-6789", "999-99-9999"],
    columns=["SSN"],
)

pattern = r"[0-9]{3}-[0-9]{2}-[0-9]{4}"
df_ssn["SSN"].str.findall(pattern)
0 [987-65-4321]
1 []
2 [123-45-6789, 321-45-6789]
3 [999-99-9999]
Name: SSN, dtype: objectPulling fields apart with .str.extract
When a pattern has capture groups, .str.extract gives back a DataFrame with one column per group, keeping only the first match in each row. This turns a single messy column into tidy fields.
pattern_groups = r"([0-9]{3})-([0-9]{2})-([0-9]{4})"
df_ssn["SSN"].str.extract(pattern_groups)If a row has several matches and you want all of them, .str.extractall returns one row per match, indexed by the original row and a match number.
df_ssn["SSN"].str.extractall(pattern_groups)Canonicalizing with .str.replace
Back in the first section we canonicalized by chaining fixed .str.replace calls. With regex=True, a single replace can strip a whole family of substrings. This pattern removes any HTML tag, that is, a <, then anything that is not a >, then a >.
df_html = pd.DataFrame(
    ["<div><td>Moo</td></div>", '<a href="x">Link</a>', "<b>Bold</b>"],
    columns=["html"],
)

df_html["html"].str.replace(r"<[^>]+>", "", regex=True)
0 Moo
1 Link
2 Bold
Name: html, dtype: objectCase study: restaurant inspections
Let’s bring this together on real data. San Francisco publishes the results of its restaurant health inspections: a score for each inspection, plus free-text descriptions of every violation found. The descriptions are written by inspectors, so they are inconsistent. Our question:
How do inspection scores vary with the number of violations that mention a particular kind of problem, like vermin or unclean surfaces?
To answer it we first have to wrangle the violation text into something countable.
vio = pd.read_csv("data/violations.csv", header=0, names=["bid", "date", "desc"])
vio.head()Each description often carries an extra note in square brackets, like [ date violation corrected ], which makes otherwise identical violations look different. Counting the raw descriptions shows how much variety that creates.
vio["desc"].value_counts().shape(14253,)We canonicalize: a regex strips the trailing bracketed note, then we trim whitespace and lowercase. The number of distinct descriptions drops sharply.
vio["clean_desc"] = (
    vio["desc"]
    .str.replace(r"\s*\[.*\]$", "", regex=True)
    .str.strip()
    .str.lower()
)
vio["clean_desc"].value_counts().shape(68,)Now we turn keywords into features. .str.contains takes a regex, and the | metacharacter means “or,” so clean|sanit flags any description mentioning cleaning or sanitation. We build one boolean column per kind of problem.
with_features = vio.assign(
    is_unclean=vio["clean_desc"].str.contains("clean|sanit"),
    is_high_risk=vio["clean_desc"].str.contains("high risk"),
    is_vermin=vio["clean_desc"].str.contains("vermin"),
    is_surface=vio["clean_desc"].str.contains("wall|ceiling|floor|surface"),
    is_human=vio["clean_desc"].str.contains("hand|glove|hair|nail"),
    is_permit=vio["clean_desc"].str.contains("permit|certif"),
)
with_features.head()The text wrangling is done. The rest is analysis you have already seen: group to count each kind of violation per inspection, reshape to a tidy table, and join in the scores.
feature_cols = [
    "is_unclean", "is_high_risk", "is_vermin",
    "is_surface", "is_human", "is_permit",
]
counts = (
    with_features.groupby(["bid", "date"])[feature_cols].sum().reset_index()
)

tidy = counts.melt(
    id_vars=["bid", "date"], var_name="feature", value_name="num_vios"
)

scores = pd.read_csv(
    "data/inspections.csv", header=0, usecols=[0, 1, 2],
    names=["bid", "score", "date"],
)
combined = tidy.merge(scores, on=["bid", "date"])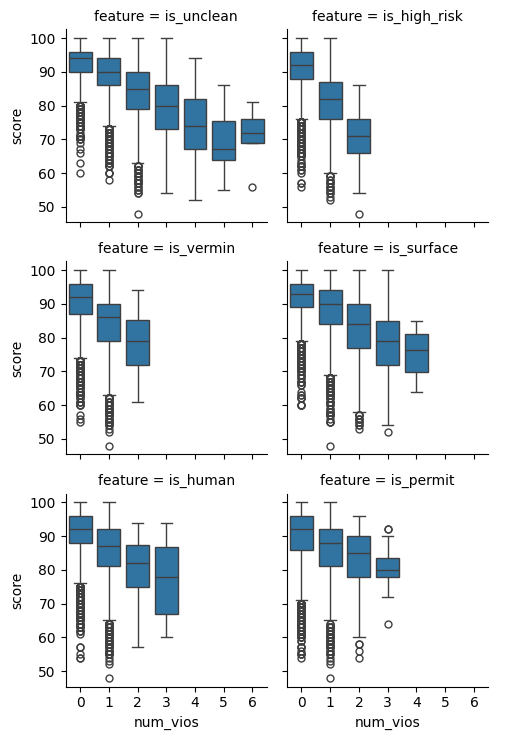
combined.head()Plotting score against the number of violations for each keyword shows the payoff. Scores drift down as violations pile up, and some keywords drag the score down faster than others. Read the plot for the trend; the plotting syntax is the subject of the visualization chapters.
import seaborn as sns

sns.catplot(
    data=combined, x="num_vios", y="score",
    col="feature", col_wrap=2, kind="box", height=2.5,
);