Author: Lance Santana
AI-assisted drafting: Claude
Developed in collaboration with Eric Van Dusen as part of the DSEP Data Science Modules initiative.
Abstract: This notebook presents an empirical investigation of Retrieval-Augmented Generation for monetary policy analysis. We evaluate whether a small open-source language model (Qwen2.5-1.5B-Instruct, 4-bit quantized) can accurately analyze Federal Reserve communications when grounded in retrieved documents. We measure performance across three retrieval methods (no retrieval, keyword-based, semantic RAG) on factual extraction, citation accuracy, and policy outcome classification using complete historical ground truth data from 2022-2026.
Section 0: Research Context
The Economic Stakes
Federal Reserve communications drive financial markets. Empirical research demonstrates:
Bernanke & Kohn (2004): “Federal Reserve Communications and Monetary Policy” shows FOMC statement language changes correlate with Treasury yield movements
Gürkaynak, Sack & Swanson (2005): “Do Actions Speak Louder Than Words? The Response of Asset Prices to Monetary Policy Actions and Statements” demonstrates market reactions to Fed communications exceed reactions to rate decisions themselves
Acosta & Meade (2015): “Hanging on Every Word: Semantic Analysis of the FOMC’s Postmeeting Statement” shows textual analysis predicts market volatility
Research Questions
Can a small language model (1.5B parameters) with retrieval-augmented generation:
Extract factual information from FOMC statements with accurate citations?
Outperform baselines (no retrieval, keyword retrieval)?
Predict rate decisions from statement text?
Refuse to answer when evidence is insufficient?
Experimental Design
Model: Qwen2.5-1.5B-Instruct (4-bit quantization)
Data: FOMC statements 2022-2026 with complete historical rate labels
Methods: No retrieval, keyword retrieval, semantic RAG
Evaluation: 8 extractable questions + 2 refusal tests, 20 policy predictions
Metrics: Factual accuracy, citation rate, groundedness, classification accuracy
Section 1: Setup and Dependencies
# Install required packages (uncomment if needed)
# !pip install -q transformers accelerate bitsandbytes sentence-transformers pandas matplotlib seaborn scikit-learn
import pandas as pd
import numpy as np
import matplotlib.pyplot as plt
import seaborn as sns
from datetime import datetime
import re
import warnings
from io import StringIO
warnings.filterwarnings('ignore')
sns.set_style('whitegrid')
plt.rcParams['figure.figsize'] = (12, 5)
print("✓ Libraries loaded")✓ Libraries loaded
Section 2: Data Loading with Complete Ground Truth Labels
# Load FOMC corpus from GitHub
FED_CORPUS_URL = "https://raw.githubusercontent.com/vtasca/fed-statement-scraping/refs/heads/master/communications.csv"

print("Loading FOMC corpus...")
df = pd.read_csv(FED_CORPUS_URL)
df['Date'] = pd.to_datetime(df['Date'])
df['Release Date'] = pd.to_datetime(df['Release Date'])

print(f"✓ Loaded {len(df):,} documents ({df['Date'].min().date()} to {df['Date'].max().date()})")
df.head()
Loading FOMC corpus...
✓ Loaded 460 documents (2000-02-02 to 2026-01-28)
Complete Historical Policy Outcomes
Source: Federal Reserve historical data on FOMC meeting decisions
Coverage: All FOMC meetings from January 2022 to January 2026
Transformation: Rate changes converted to categorical labels (Raise/Hold/Lower)
This ensures full reproducibility with publicly available data.
Getting the FOMC Rates and merging with statements:
url = "https://fred.stlouisfed.org/graph/fredgraph.csv?id=DFEDTARL&cosd=2000-01-01&coed=2026-03-08"
print("Loading FOMC target rate data...")
df_rate = pd.read_csv(url)
df_rate['Date'] = pd.to_datetime(df_rate['observation_date'])
df_rate
Loading FOMC target rate data...
Looks like this is daily data
Lets make a column for when the rate changes occur, and then we can merge it with the statements based on date.
# Extract statements and filter for 2008-2026 coverage
statements_panel = (
    df[df['Type'] == 'Statement']
    .copy()
    .sort_values('Date')
    .reset_index(drop=True)
 )

statements_panel = statements_panel[
    (statements_panel['Date'] >= pd.Timestamp('2008-12-15'))
    & (statements_panel['Date'] <= pd.Timestamp('2026-12-31'))
].reset_index(drop=True)

preview_cols = ['Date', 'Type']
if 'Title' in statements_panel.columns:
    preview_cols.insert(1, 'Title')

print(
    f"Statements available: {len(statements_panel)}"
    f" ({statements_panel['Date'].min().date()} to {statements_panel['Date'].max().date()})"
 )
statements_panel.head()
Statements available: 142 (2008-12-16 to 2026-01-28)
# Clean dates
statements_panel["Date"] = pd.to_datetime(statements_panel["Date"])
df_rate["Date"] = pd.to_datetime(df_rate["Date"])

# Keep only the rate history columns you need
fed_target_history = (
    df_rate[["Date", "DFEDTARL"]]
    .dropna()
    .sort_values("Date")
    .reset_index(drop=True)
)

# Match each statement to the most recent available target rate
statements_with_rate = pd.merge_asof(
    statements_panel.sort_values("Date"),
    fed_target_history,
    on="Date",
    direction="backward"
)

# Compute meeting-to-meeting policy change
statements_with_rate["delta"] = statements_with_rate["DFEDTARL"].diff()

# Label the policy move
statements_with_rate["Decision"] = statements_with_rate["delta"].apply(
    lambda x: "Raise" if x > 0 else ("Lower" if x < 0 else "Hold")
)

# First meeting has no previous meeting for comparison
statements_with_rate.loc[statements_with_rate["delta"].isna(), "Decision"] = None

statements_with_rate.head()
statements_with_rate = statements_with_rate.dropna(subset=["DFEDTARL","delta"]).reset_index(drop=True)
statements_with_ratestatement_policy_panel = statements_with_rateprint(
f"✓ Matched {len(statement_policy_panel)} statements to target rates "
f"({statement_policy_panel['Date'].min().date()} - {statement_policy_panel['Date'].max().date()})"
)
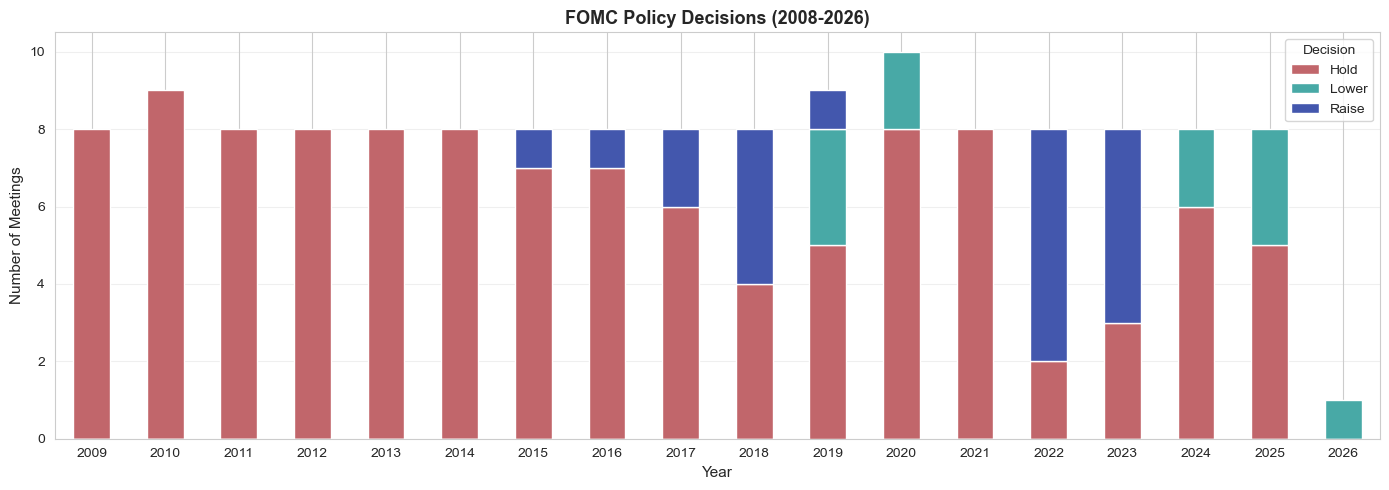
print("Decision distribution:")
print(statement_policy_panel['Decision'].value_counts())
fig, ax = plt.subplots(figsize=(14, 5))
yearly = statement_policy_panel.groupby(
[statement_policy_panel['Date'].dt.year, 'Decision']
).size().unstack(fill_value=0)
yearly.plot(kind='bar', stacked=True, ax=ax, color=['#C1666B', '#48A9A6', '#4357AD'])
ax.set_xlabel('Year', fontsize=11)
ax.set_ylabel('Number of Meetings', fontsize=11)
ax.set_title('FOMC Policy Decisions (2008-2026)', fontsize=13, fontweight='bold')
ax.legend(title='Decision')
ax.grid(axis='y', alpha=0.3)
plt.xticks(rotation=0)
plt.tight_layout()
plt.show()✓ Matched 141 statements to target rates (2009-01-28 - 2026-01-28)
Decision distribution:
Decision
Hold 110
Raise 20
Lower 11
Name: count, dtype: int64
# write panel to csv for later use
statement_policy_panel.to_csv("fomc_statement_policy_panel.csv", index=False)
print("✓ Statement-policy panel saved to 'fomc_statement_policy_panel.csv'")
✓ Statement-policy panel saved to 'fomc_statement_policy_panel.csv'
Summary: We have complete ground truth labels for 141 FOMC meetings (2009-2026), covering the full tightening cycle (2022-2023) and subsequent holds and cuts (2024-2025).