The Data Science Lifecycle
This notebook walks through one pass of the lifecycle with a concrete example. We will:
Start with a question (e.g., who are the students? what are their majors?)
Acquire data (load tables we need)
Explore the data (inspect structure, peek at rows)
Answer a question (e.g., how many students?)
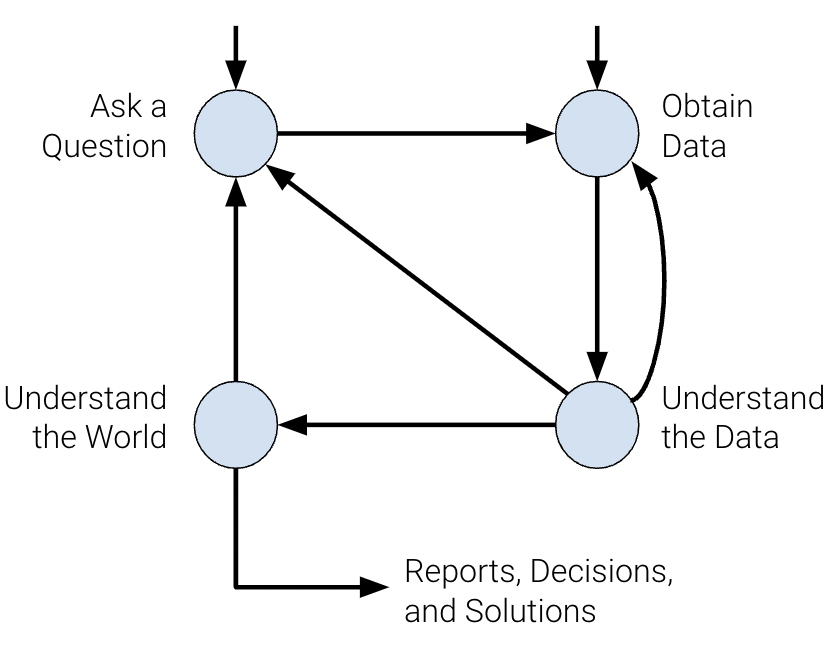
The lifecycle at a glance
The data science process moves from question → data → analysis. The diagram below summarizes the main stages. In this notebook we do one pass: question, acquire data, explore, then answer one simple question.
1. Starting with a question
Lifecycle stage: Question
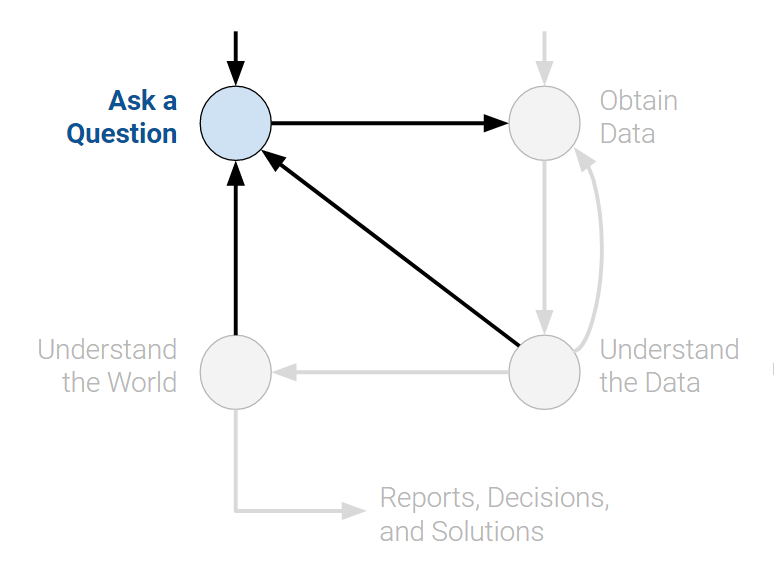
We start with a goal: learn something about the students in the course. Here are some simple questions we might ask:
How many students do we have?
What are their majors?
What year are they?
How did major enrollment change over time?
In this walkthrough we use a small dataset (names and majors) to illustrate the next steps.
2. Data acquisition and cleaning
Lifecycle stage: Data
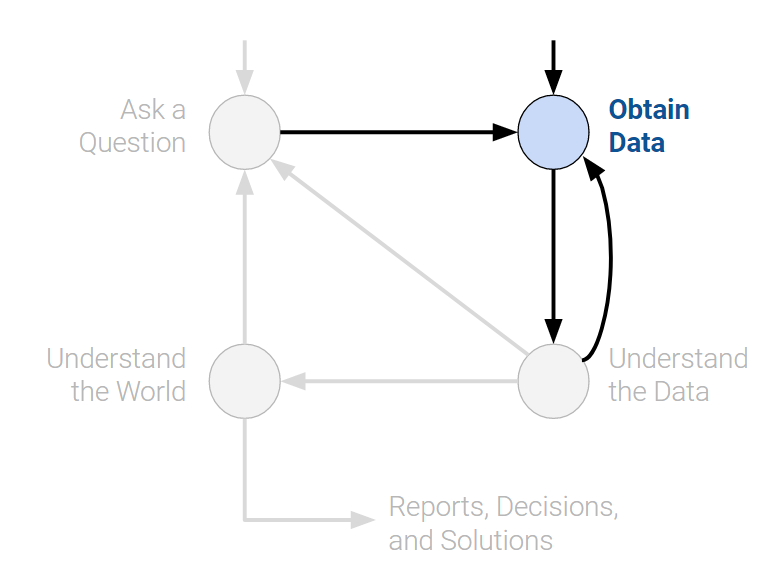
To answer our questions we need data. Here we load two CSV files: one with majors and one with names. In later chapters you will learn more ways to collect and load data; for now we use pandas to read the files.
import pandas as pd

# Load data (paths relative to this notebook)
majors = pd.read_csv("data/majors-sp24.csv")
names = pd.read_csv("data/names-sp24.csv")
3. Exploratory data analysis
Lifecycle stage: Explore
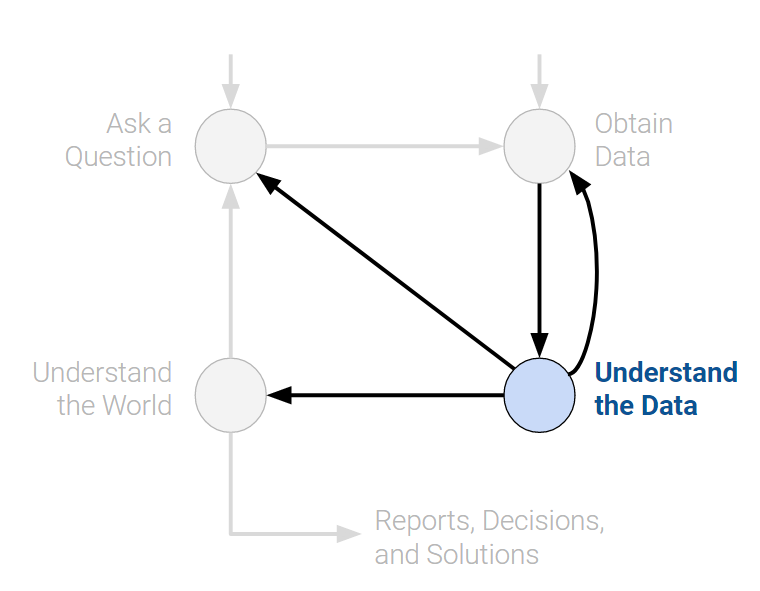
Before answering our questions we need to understand the data: its structure, columns, and any obvious issues. Let’s peek at the data.
Peeking at the data
# First 20 rows of the majors table
majors.head(20)# First 5 rows of the names table (default)
names.head()We can see the structure: majors has columns like major and terms in attendance; names has a single name column. Notice that some names are capitalized and some are not; that is the kind of inconsistency we often clean before deeper analysis.
4. Answering a question
Lifecycle stage: Analysis
We asked: How many students do we have? Now we can answer using the data we loaded and explored.
# How many students? (each row in majors is one student)
len(majors)1276That completes one pass through the lifecycle: question (who are the students?) → data (load majors and names) → explore (peek at structure) → answer (how many?).